What do the symbols in the cycle curve mean?

With a little practice, you will quickly become familiar with the handling of the cycle curve in your trackle app. Here we explain the colors and symbols in detail. As always, if you have any questions, please contact us at info@trackle.de.

A red dot in brackets means that a fault has been entered for this value in the trackle app. This value is not included in the calculation.
The dashed line, also called auxiliary line is used for a better overview. The 6 values before the first higher measurement are considered. The auxiliary line is at the height of the highest temperature of these 6 values. The third higher measurement (marked with the triangle see below) must be 0.2 °C above the auxiliary line.
In the symptothermal method, the triangles are the first 3 (or 4) higher readings compared to the previous 6 readings. The three triangles are entered as soon as the temperature high has been determined. The third „triangle“ must be 0.2 °C above the auxiliary line (see above).
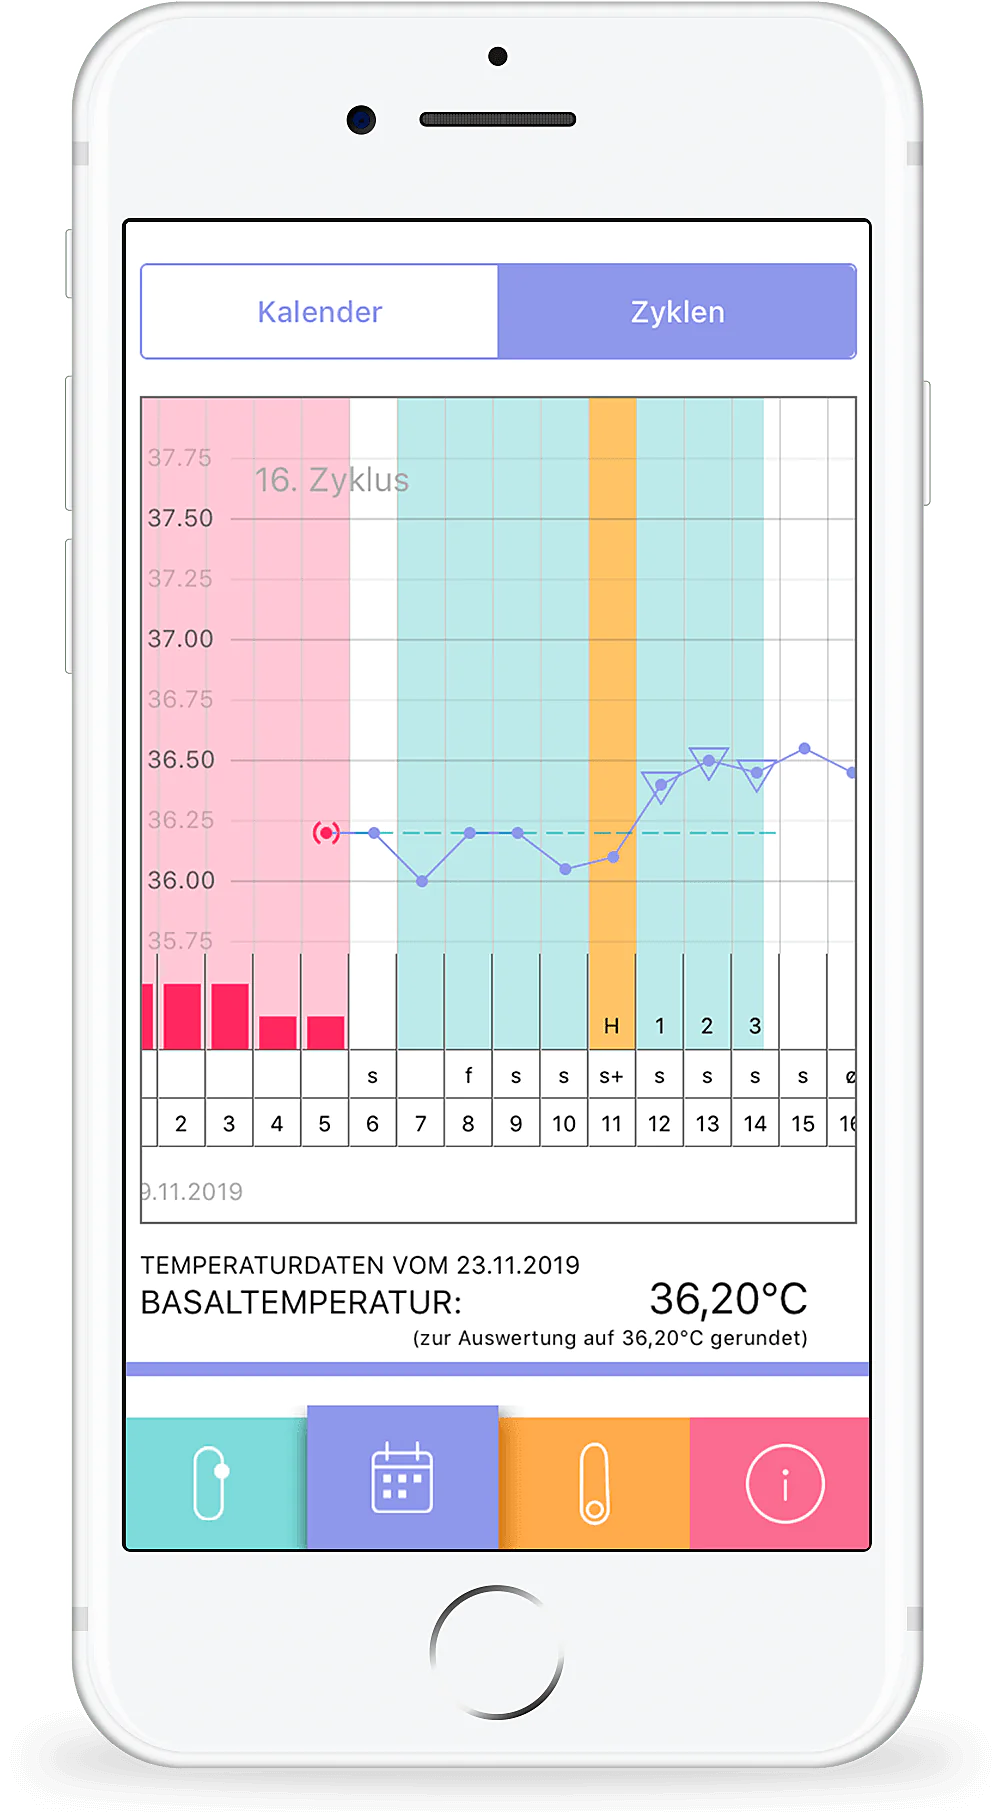
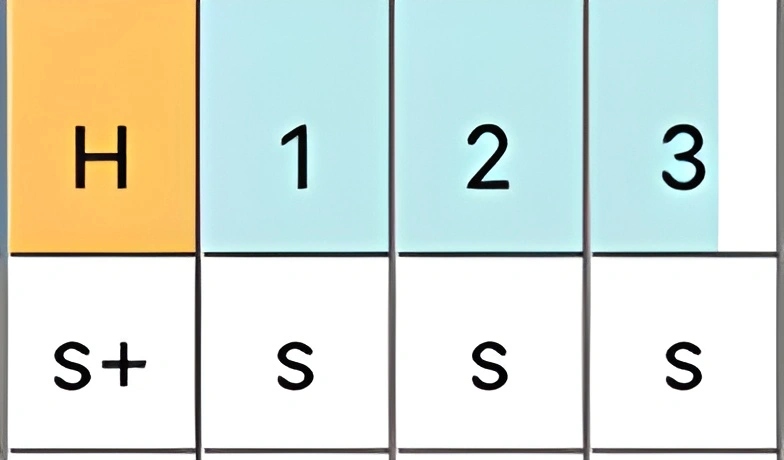
Above some cervical mucus data is the indication (H, 1, 2, 3). This describes the cervical mucus evaluation. Once the cervical mucus peak has been determined, the corresponding days are marked with (H, 1, 2, 3). H: Cervical mucus with the best quality.______________________1: Cervical mucus with lower quality than H2: Cervical mucus with lower quality than H3: Cervical mucus with lower quality than HH, 1, 2, 3 together gives the cervical mucus peak. ______________________More information about cervical mucus can be found here.

Labels

The red marking of the individual days in the cycle view indicates the entered bleeding. The weaker the bleeding, the smaller the respective red box.
A strong turquoise marking of a day indicates a fertile day.
A strong yellow day in the cycle view marks the detected ovulation.
A white/grey marking of a day indicates an infertile day.
Nach oben scrollen